
: The Sentier Research monthly median household income data series is now available for August. Nominal median household incomes were up $123 month-over-month and $1,151 year-over-year. However, adjusted for inflation, real incomes increased only $76 MoM and are up only $374 YoY (0.1% and 0.7%, respectively). And these numbers do not factor in the expiration of the 2% FICA tax cut. The median real household income is down 7.2% since the beginning of the century.
The traditional source of household income data is the Census Bureau, which publishes annual household income data in mid-September for the previous year. The 2012 annual updates were published last week.
Sentier Research, an organization that focuses on income and demographics, offers a more up-to-date glimpse of household incomes by accessing the Census Bureau data and publishing monthly updates. Sentier Research has now released its most recent update, data through August (available here). The data in their report differs from the Census Bureau's data in three key respects:
- It is a monthly rather than annual series, which gives a more granular view of trends.
- Their numbers are more current. The Census Bureau's 2012 data will remain its latest until September 2014.
- Sentier Research uses the more familiar Consumer Price Index (CPI) for the inflation adjustment. The Census Bureau uses the little-known CPI-U-RS (RS stands for "research series") as the deflator for their annual data. For more on that topic, see this commentary.
The first chart below is an overlay of the nominal values and real monthly values chained in August 2013 dollars. The red line illustrates the history of nominal median household, and the blue line shows the real (inflation-adjusted value). I've added callouts to show specific nominal and real monthly values for January 2000 start date and the peak and post-peak troughs.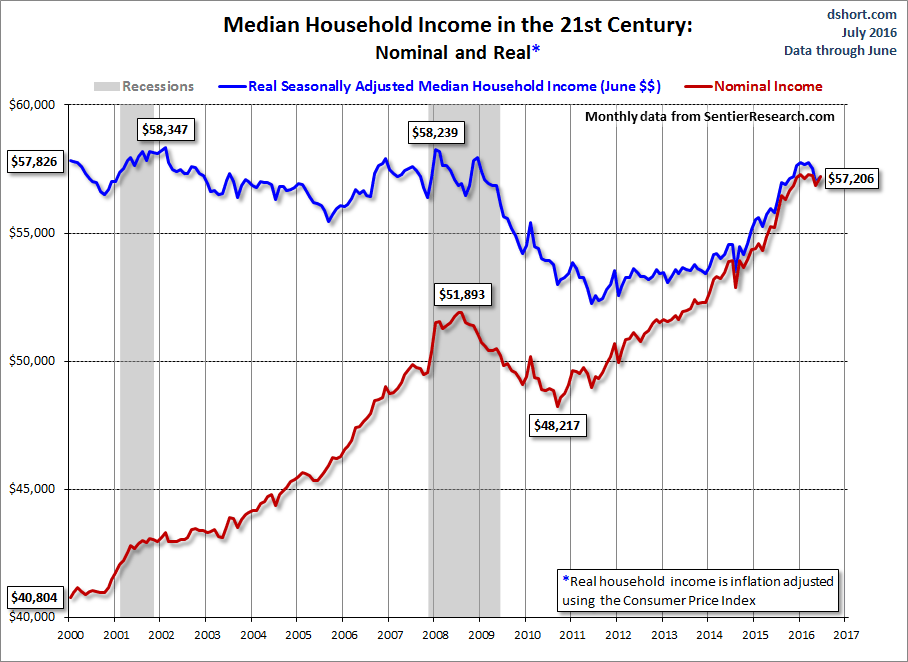
In the latest press release, Sentier Research spokesman Gordon Green summarizes the recent data.
Since December 2011 we have been in a period of income stagnation without any clear trend of direction. Real median annual household income has essentially remained at the same level over this time period, despite significant reductions in the official unemployment rate, the average duration of unemployment, and a broad measure of employment hardship. The failure of an improved labor market to translate into higher levels of household income raises troubling questions about the types of jobs created over the past year and a half, the level of pay that they generate, and the effect on household income levels from people who have dropped out of the labor force altogether.
As for the data itself, Sentier makes it available in Excel format for a small fee (here). I have used the latest data to create a pair of charts illustrating the nominal and real income trends during the 21st century.
The blue line in the chart above paints the grim "real" picture. Since we've chained in August 2013 dollars and the overall timeframe has been inflationary, the earlier monthly values are adjusted upward accordingly. In addition to the obvious difference in earlier real values, we can also see that real incomes peaked before the nominal (January of 2008, one month after the recession began, versus July 2008). Also the real post-recession decline bottomed later than the nominal (August 2011 versus September 2010).
The next chart is my preferred way to show the nominal and real household income -- the percent change over time. Essentially I have taken the monthly series for both the nominal and real household incomes and divided them by their respective values at the beginning of 2000. The advantage to this approach is that it clearly quantifies the changes in both series and avoids a common distraction of using dollar amounts ("How does my household stack up?").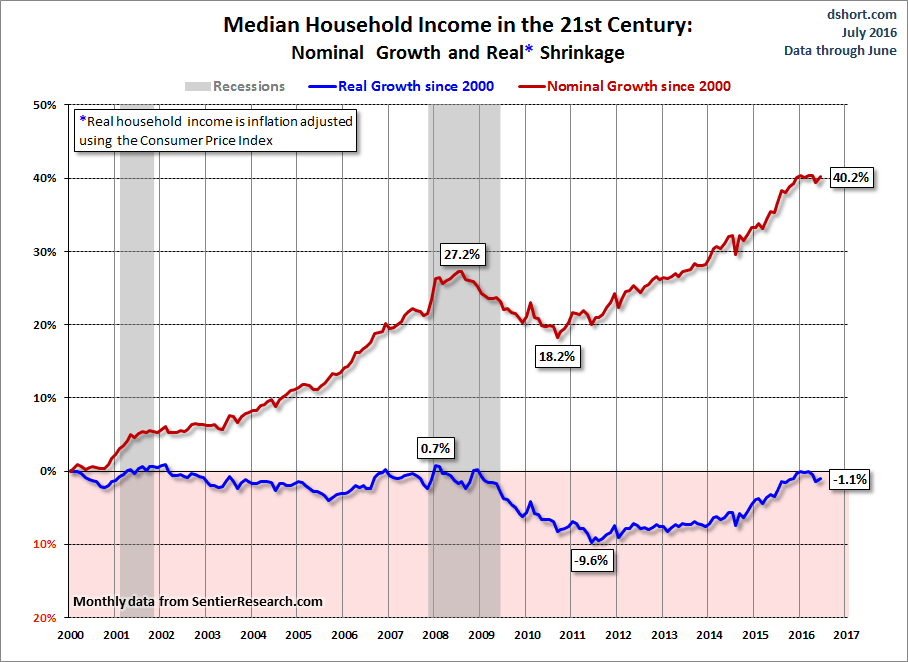
The stunning reality illustrated here is that the real median household income series spent most of the first nine years of the 21st century struggling slightly below its purchasing power at the turn of the century. Real incomes (the blue line) hit an interim peak at a fractional 0.7% in early 2008, far below the nominal illusionary peak (as in money illusion) of 27.2% six months later and now at a new interim high of 28.0%. In contrast, the real recovery from the trough has been depressingly slight.
Let's take a closer look at the monthly data since the end of the Great Recession. The adjacent chart highlights the real monthly median values since 2008. The right axis shows the same scale as the chart above -- the percent change from the real household income value at the start of the 21st century. The August 2013 real median annual income ($52,236) is stuck at a level fractionally below its interim high in January 2011 and 7.2% below is 21st century high in January 2008. But the actual household experience is worse than these numbers suggest. The Sentier calculations are based on pre-tax data. The expiration of the 2% FICA tax has put an additional hit on disposable household incomes.
Is there seasonality to the monthly data? The column chart shows the monthly averages of nominal month-over-month change since 2000. December is the top performer with January a close second. March has a negative average since the turn of the century. However, the month-over-month volatility of the Consumer Price Index reduces the reliability of the nominal pattern as a clue for what to expect in the in the months ahead.
In Summary...
As the excellent data from Sentier Research makes clear, the mainstream U.S. household was struggling before the Great Recession. At this point, real household incomes are in worse shape than they were four years ago when the recession ended.
I'll close this update with another look at real growth, highlighting the actual monthly data points and adding a three-month moving average. The MA trend has been zigzagging higher since the trough in 2011, although the trend over the past 12 months has been one of sideways volatility.
Check back next month for the latest update.